Agentic data analytics platform that tells you what to do next

BUILT ON

A Context Layer
that's always current

Built for data, product, and business teams: ClarityQ delivers deep analysis, insights, action plans, dashboards, and reports - all in natural language.

At the core is a context layer that's built automatically and kept in order continuously, turning messy data into accurate, trusted answers.
6⨯
Productivity gain
3.6h
Saved per single ClarityQ session
1B+
Data rows covered by ClarityQ analyses
<2d
from connection to first trusted answer
Quote icon
Guy Tomer, Co-founder and COO, CrazyLabs

ClarityQ has been a real game-changer for us! It lets our entire gaming team work with data at scale. We’re querying billions of events and dozens of tables, with in-depth analysis delivered in seconds. It empowers both analysts and game owners with 5× greater efficiency and real data superpowers - saving countless hours of analysis and enabling faster, better decisions.

CrazyLabs logo
Guy Tomer

Co-founder & COO, CrazyLabs

Quote icon
Avner Azulay, Zaffic


ClarityQ became a critical decision layer for us, turning complex behavioral data into clear actions. We identified friction points in our onboarding and loyalty mechanics, which led us to remove low-impact features and focus on real revenue growth.
‍

Zaffic logo
Avner Azulay

Director of Product, Zaffic

Quote icon
Eduardo, App Generation

ClarityQ lets our Marketing and Product teams get answers in minutes instead of hours. We used to juggle Firebase, GA, AdMob, Adjust - now everything lives in one place. Our analysis is easily 10x faster, saving us hours every time. But the real game-changer is the insights we wouldn't have found on our own - things we didn't even know to look for.

App Generation logo
Eduardo Carqueja

CEO, Appgeneration

Quote icon
Mark Shohat, Spiral Interactive


ClarityQ (or "Clara" as we refer to it) functions as a co-pilot analyst providing me and other stakeholders (including users who are resistant to use the standard reporting tools available in the company) with business insights via very friendly and convenient interface and visual outputs.

Spiral Interactive logo
Mark Shohat

Head of Business Analysis, Spiral Interactive

Quote icon
Marcos del Molino, Softonic


Thanks to the ClarityQ Agent and strong team support, we found the perfect analysis wingman. It has significantly sped up our deep-dive analyses, is expected to cut analysis time by at least half and has freed up time to focus more on strategic work.
‍

Softonic logo
Marcos del Molino

Data Analyst, Softonic

Built for the data you actually have
No data-modeling project. No semantic-layer rebuild. No "clean it first." ClarityQ understands your messy reality and reasons across sources.
Auto-Maintained Context Layer.
Always current. Treated like code.
ClarityQ builds and maintains your Context Layer, Semantic Layer and Data-Catalogs: Your business logic, metrics, rules, table connections, in-app events, and more - so every answer is based on the right, most current data, even in the messiest reality.
‍
A change management engine keeps that context in order: it proposes additions and fixes, resolves duplicates and inconsistencies, and protects the health of your Context Layer over time. Every change is tracked and reviewable, like version control for your business context. Read more
Cross-Source by design
One question. Every source.
Combine sales + finance, revenue + marketing spend, product in a single ask. ClarityQ analyzes trends across different functions.
Interactive agent.
Asks back when it matters.
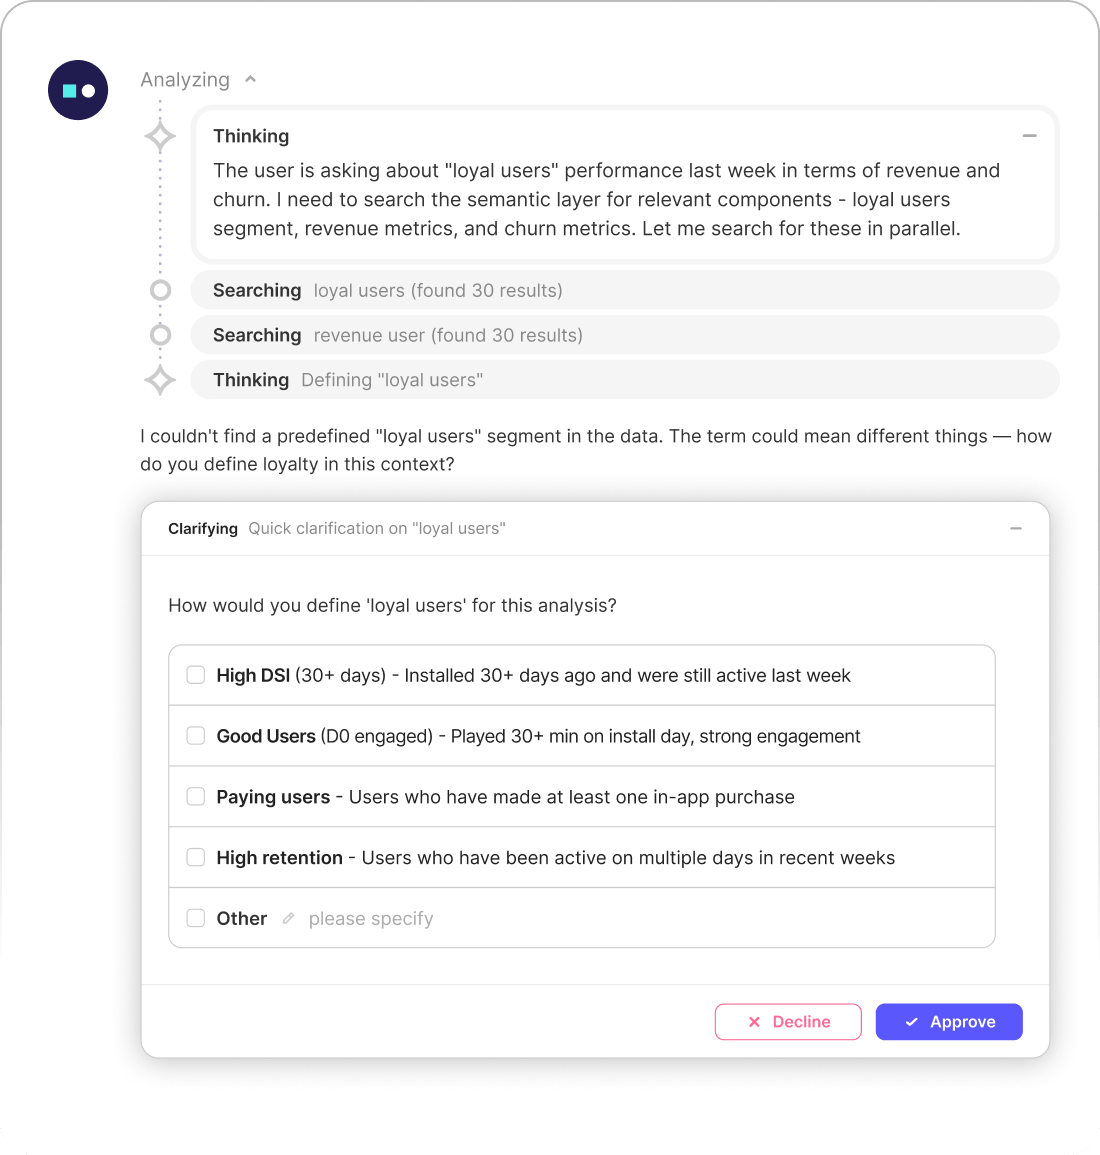
When there’s ambiguity - duplicate metrics, overlapping definitions, missing periods - ClarityQ surfaces choices instead of guessing silently.
Watch the ClarityQ demo videoStart now with ClarityQ
An All-in-One Agentic Data Analysis
Built for Your Data, Product and Business Teams
AI Agent.
Beyond Manual Barriers.
How it works
Transparent reasoning icon
Transparent reasoning, SQL and sources behind every answer
Validation engine icon
Built-in validation engine
Cross-dimensional analysis icon
Cross-dimensional analysis
Data, visualizations and insights icon
Data, visualizations, insights and action plans in one response
Dashboards and automated reports icon
NL-created dashboards and automated reports 
Governed and role-aware icon
Governed, collaborative and role-aware
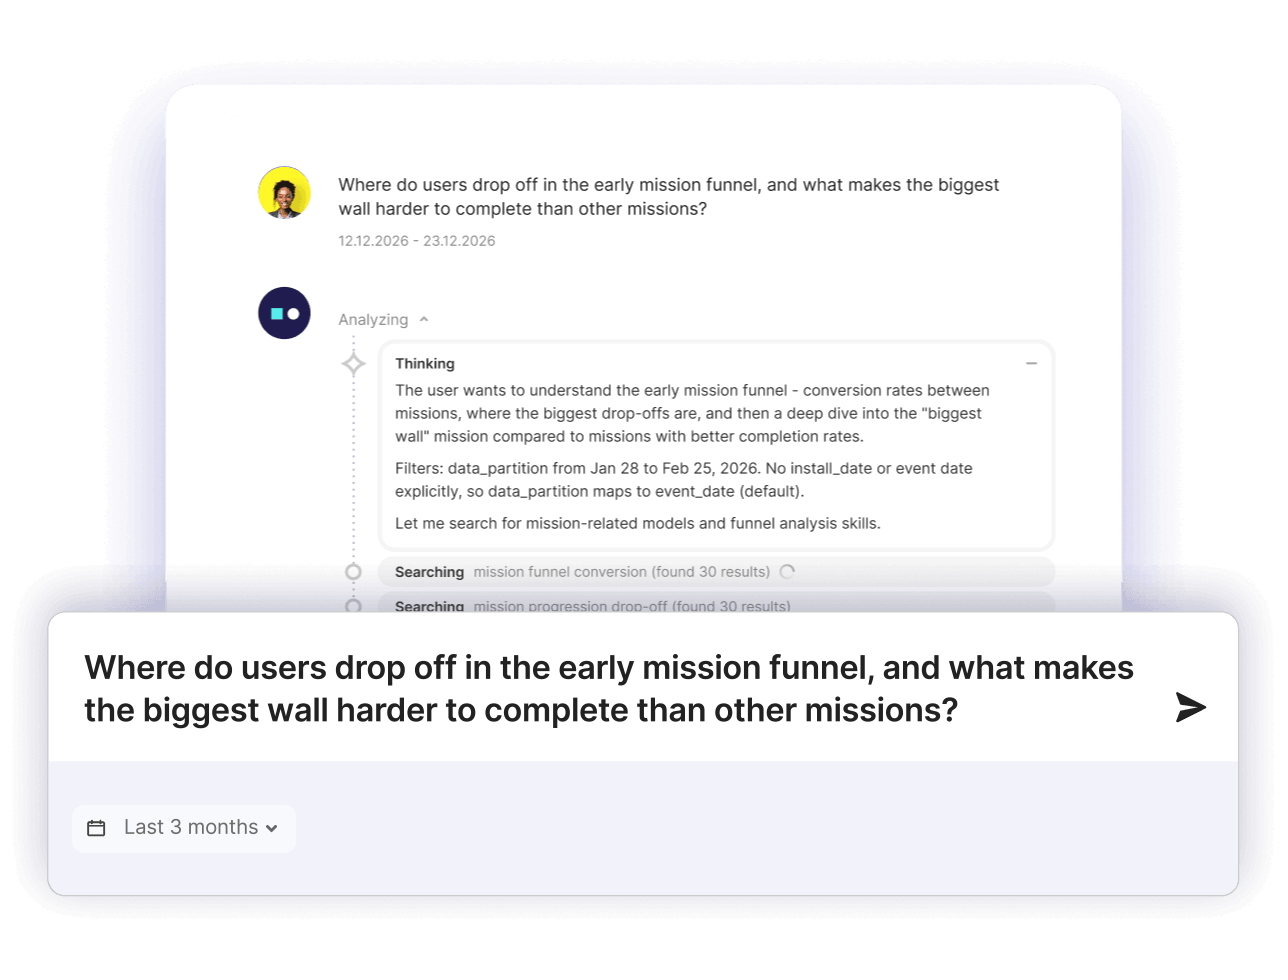
ClarityQ Ask Me Anything: a plain-language question answered with data and charts
Your Data, Mapped, Governed and Kept in-order.
How it works
Transparent reasoning icon
Maps and understands tables, events, metrics, segments and entities across data sources
Validation engine icon
Dynamic, editable and version-controlled
Cross-dimensional analysis icon
Learns and adapts through Skills, Memory and Rules
Data, visualizations and insights icon
Human-in-the-loop validation when necessary
Dashboards and automated reports icon
Syncs with existing catalogs, semantic and contextual layers
Governed and role-aware icon
Open API
Context catalog
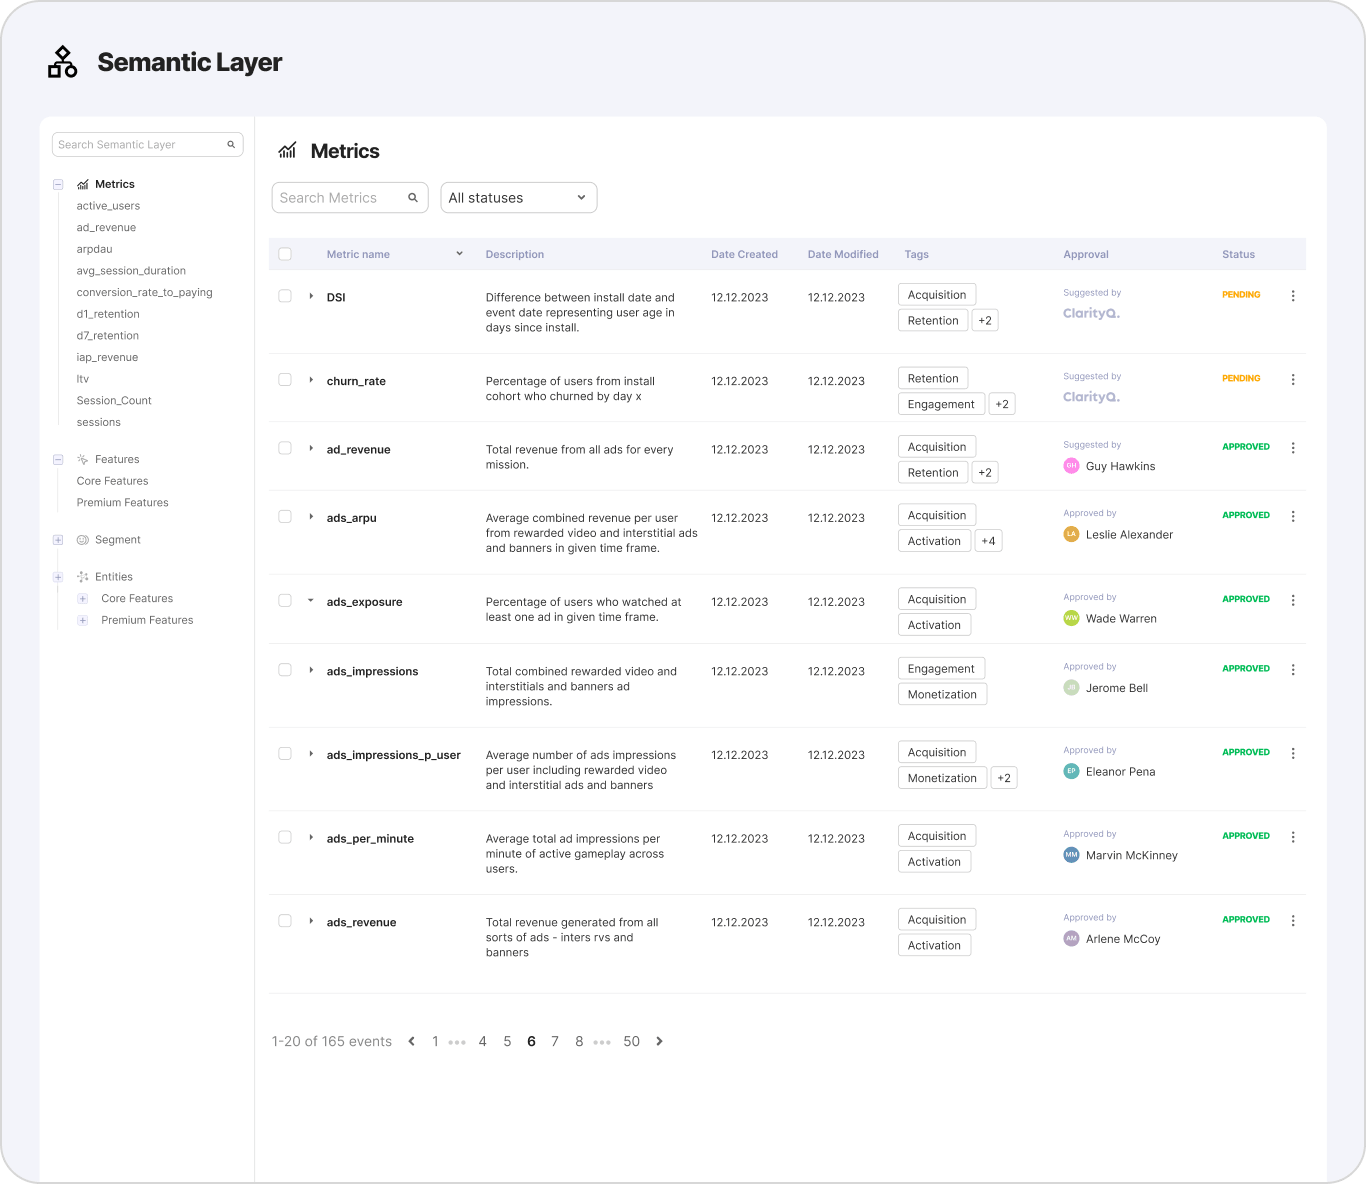
ClarityQ Context Layer mapping tables, events, metrics and segments
Instant Dashboards and Automations
How it works
Transparent reasoning icon
Generate full dashboards from a single prompt
Validation engine icon
Edit and query in natural language
Cross-dimensional analysis icon
Interactive, filterable and always up to date
Data, visualizations and insights icon
Share across teams with governed access
Dashboards and automated reports icon
Automated reports to your mailbox or Slack 
Dashboards
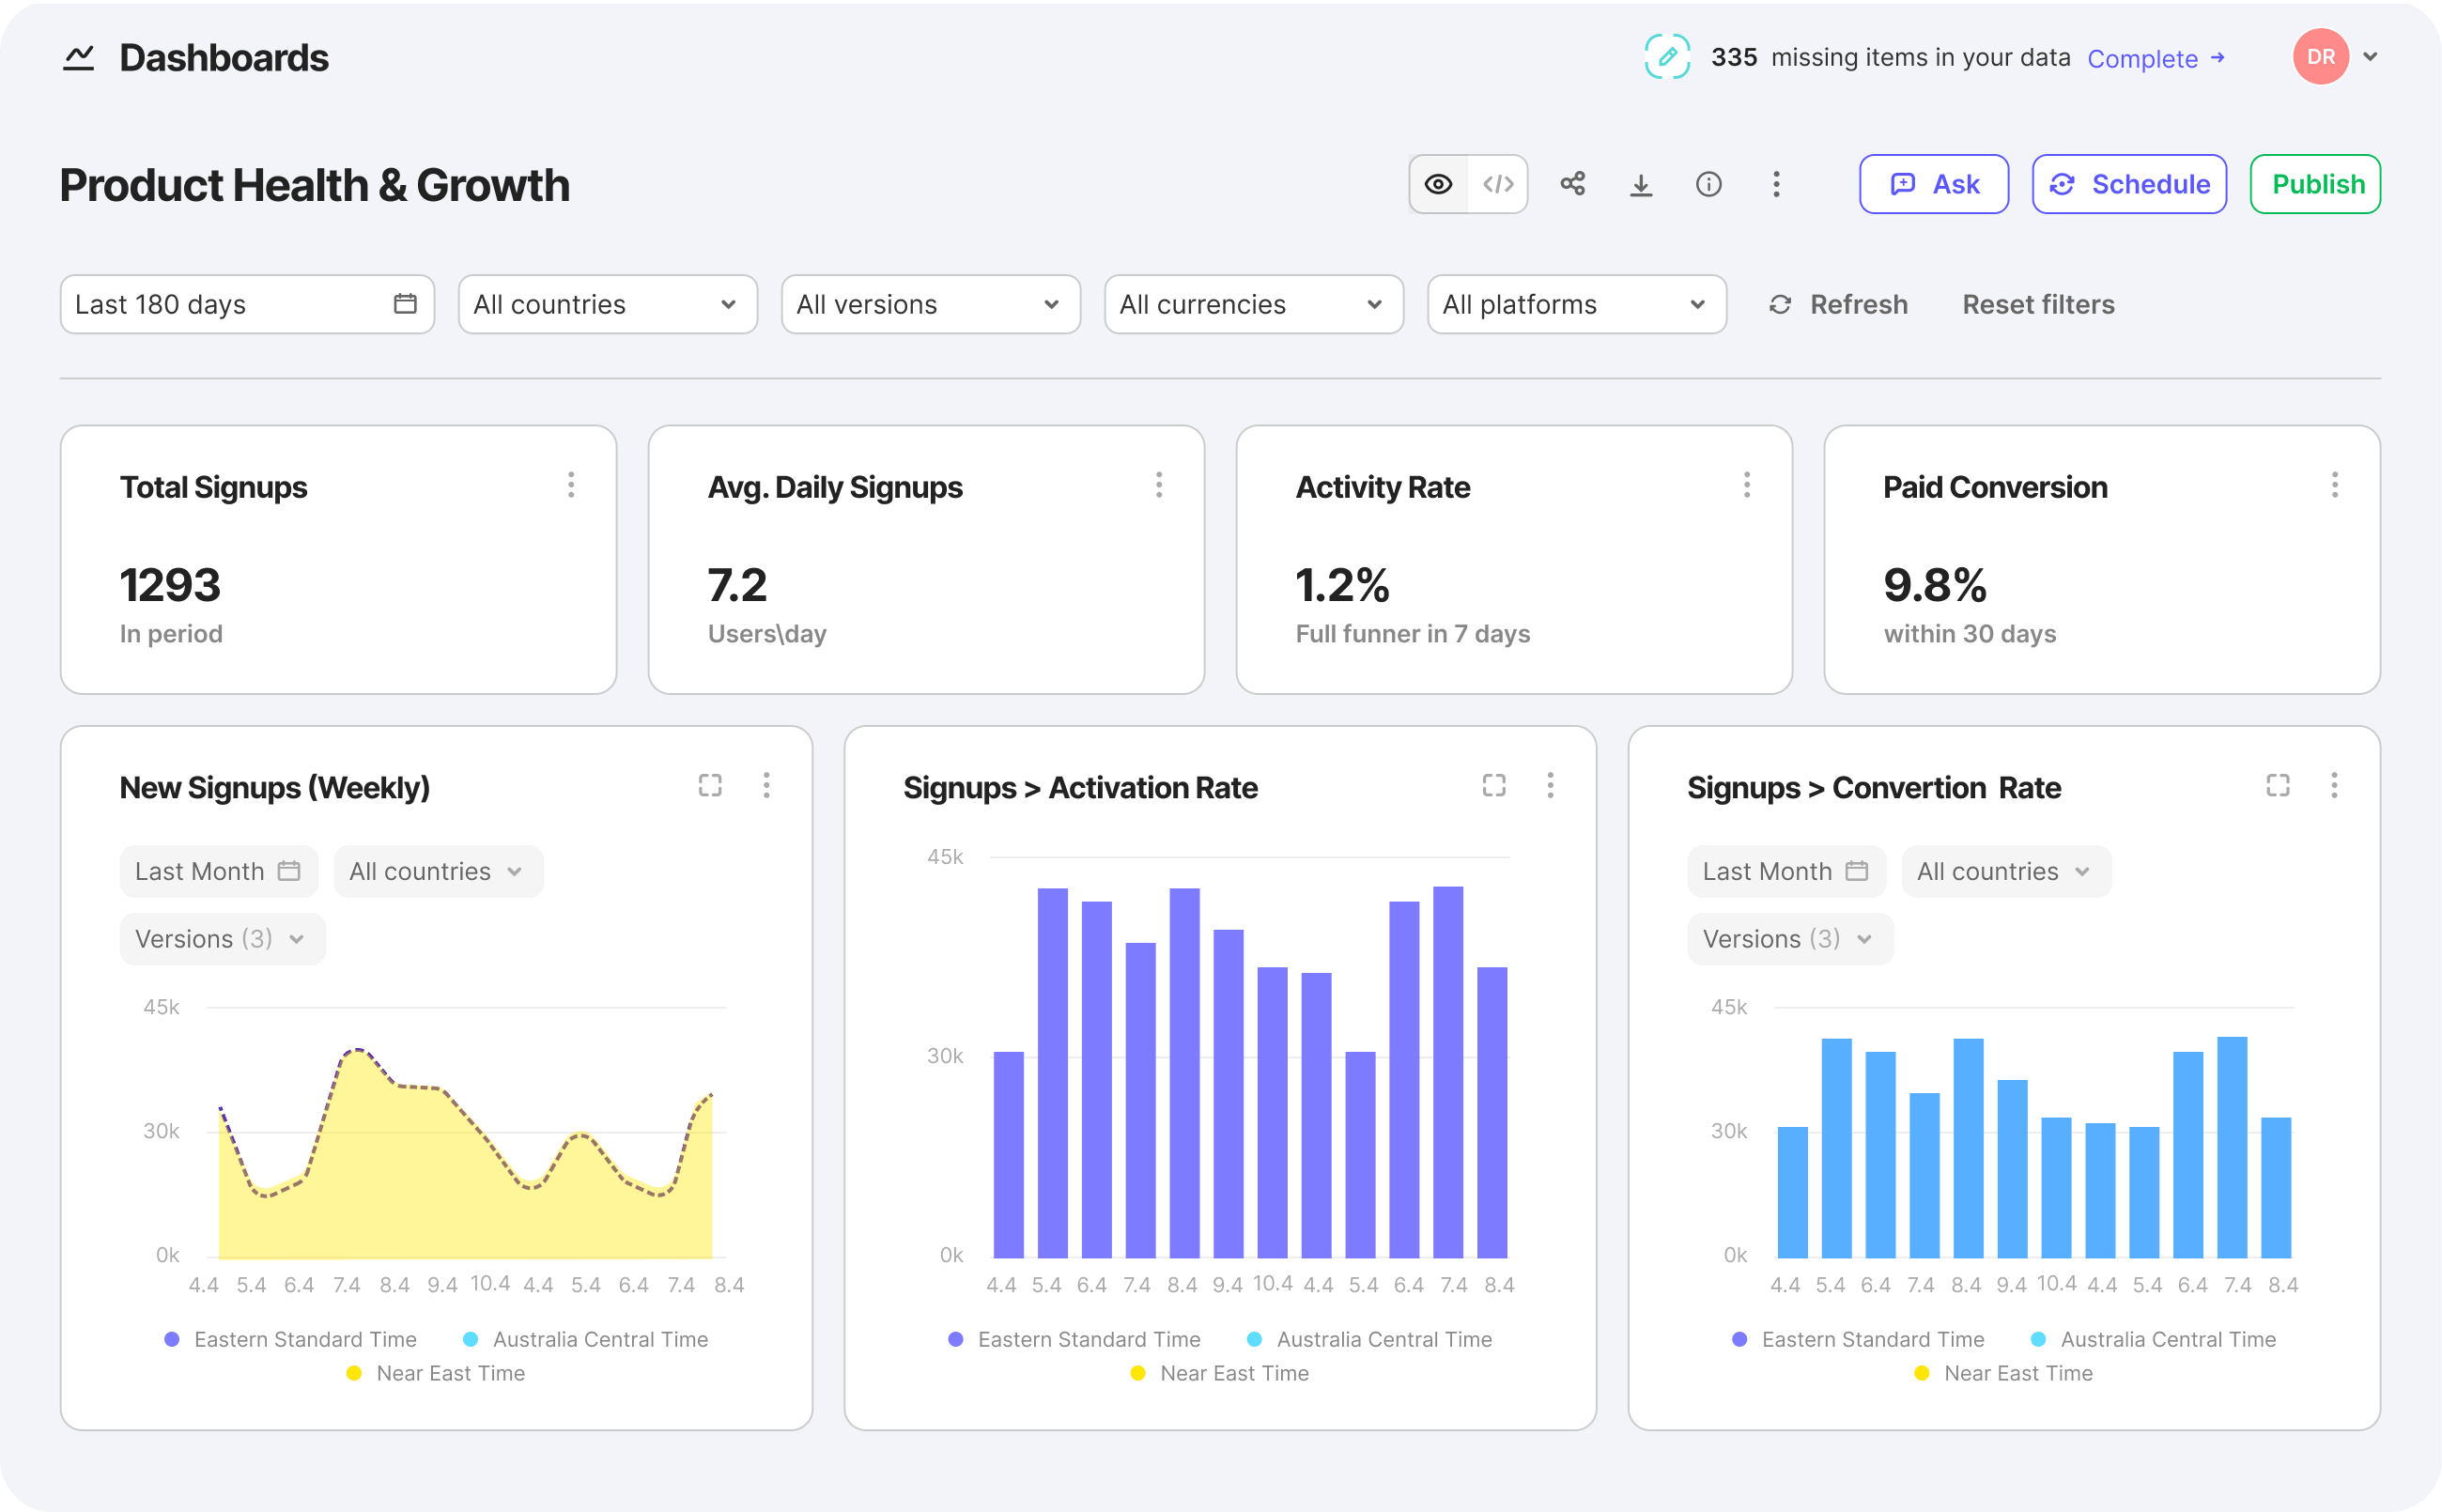
ClarityQ dashboard generated from a single prompt
It clarifies. It doesn't guess.

When a question has more than one valid answer, ClarityQ pauses and asks - surfacing duplicates, conflicting definitions, missing windows or ambiguous filters - so the answer you ship is the one you meant. It then uses your feedback to continiously optimise your context layer under the hood.
ClarityQ asking a clarifying question before answering
Live in Hours or Days,
Not Quarters.
Connect your stack icon

Connect your stack

Warehouse, product analytics & BI tooling, read -only, in minutes.

Build the context layer icon

Build the context layer

ClarityQ understand your business context, semantics and catalogs -  metrics, segments  and definitions.

Ask, decide, act icon

Ask, decide, act

Every team gets trusted answers, insights… while the context layer is constantly audited and kept intact.

Plugs into your warehouse and your BI 

Native connectors to every major cloud DWH and BI tool. Read-only by default.

Transparent reasoning icon
Read-only
Dashboards and automated reports icon
SOC 2 Type II
Validation engine icon
GDPR
Cross-dimensional analysis icon
Private Link
Data, visualizations and insights icon
Single Tenant Option

Data Warehouses

Snowflake logo
Snowflake
BigQuery logo
BigQuery
Redshift logo
Redshift
Databricks logo
Databricks
Postgres logo
Postgres
Amazon Athena logo
Amazon Athena
Azure Synapse Analytics logo
Azure Synapse
ClickHouse logo
ClickHouse

BI and Visualisation

Looker logo
Looker
Tableau logo
Tableau
Power BI logo
Power BI
ClarityQ logo
Metabase

Frequently Asked Questions

What data challenges does ClarityQ help solve?

Can ClarityQ generate charts, funnels, or retention curves?

Can ClarityQ be used for product, user, growth, and revenue analysis?

Is ClarityQ secure and compliant with data protection standards?

How is ClarityQ priced?

What data sources does ClarityQ support and how does it integrate?

View all

Ready to transform how you work with data?

Start Now